请教大位大神,下面这个图是用什么软件画的?看着很好看,我用origin没有画出来呢 返回小木虫查看更多
怎么感觉excel做的
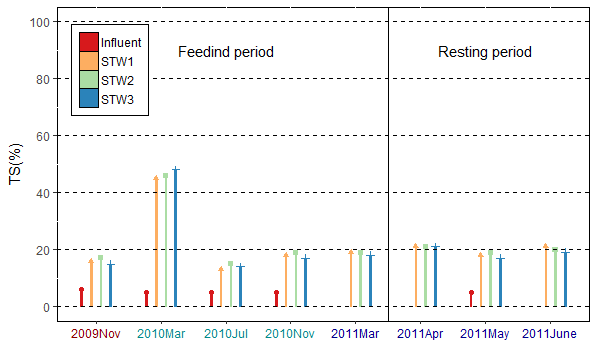
ggplot2可以应付,替换下面的TS数据 > require(ggplot2) > figuredata <- read.csv("c:/figuredata.csv", + header = TRUE) > figuredata YearMonth Type TS 1 2009Nov Influent 6 2 2009Nov STW1 16 3 2009Nov STW2 17 4 2009Nov STW3 15 5 2010Mar Influent 5 6 2010Mar STW1 13 7 2010Mar STW2 15 8 2010Mar STW3 14 9 2010Jul Influent 5 10 2010Jul STW1 45 11 2010Jul STW2 46 12 2010Jul STW3 48 13 2010Nov Influent 5 14 2010Nov STW1 18 15 2010Nov STW2 19 16 2010Nov STW3 17 17 2011Mar Influent 5 18 2011Mar STW1 18 19 2011Mar STW2 19 20 2011Mar STW3 17 21 2011Apr Influent NA 22 2011Apr STW1 19 23 2011Apr STW2 19 24 2011Apr STW3 18 25 2011May Influent NA 26 2011May STW1 21 27 2011May STW2 20 28 2011May STW3 19 29 2011June Influent NA 30 2011June STW1 21 31 2011June STW2 21 32 2011June STW3 21 > levels(figuredata$YearMonth) <- + figuredata$YearMonth[seq(1, 32, by = 4)] > > > ggplot(figuredata, aes(x = YearMonth, y = TS)) + + geom_col(aes(color = Type, fill = Type), + width = 0.1, + position = position_dodge(width = 0.6)) + + geom_point(aes(color = Type, shape = Type), + position = position_dodge(width = 0.6)) + + scale_y_continuous(limits = c(0,100), + breaks = seq(0,100,by = 20)) + + geom_vline(xintercept = 5.5) + + annotate("text", x = c(3, 7), y = c(90, 90), + label = c("Feedind period", "Resting period") + + geom_hline(yintercept = seq(0,100,by = 20), linetype = 2) + + theme(panel.background = element_rect(fill = "white", + colour = "black", + legend.background = element_blank(), + legend.position = c(0.1,0.8), + legend.title = element_blank(), + legend.box.background = element_rect(fill = "white", + colour = "black", + legend.key = element_rect(colour = "black", + legend.key.width = unit(0.5, units = "cm", + legend.key.height = unit(0.5, units = "cm", + axis.text.x = element_text(colour = c("darkred", + rep("darkcyan", 3), + rep("darkblue", 4)))) + + labs(x = NULL, y = "TS(%)" + + scale_color_brewer(palette = "Spectral", type = "seq" + + scale_fill_brewer(palette = "Spectral", type = "seq" Rplot.png ,
表情是圆括号右半部分,“)”,


怎么感觉excel做的
ggplot2可以应付,替换下面的TS数据
> require(ggplot2)
> figuredata <- read.csv("c:/figuredata.csv",
+ header = TRUE)
> figuredata
YearMonth Type TS
1 2009Nov Influent 6
2 2009Nov STW1 16
3 2009Nov STW2 17
4 2009Nov STW3 15
5 2010Mar Influent 5
6 2010Mar STW1 13
7 2010Mar STW2 15
8 2010Mar STW3 14
9 2010Jul Influent 5
10 2010Jul STW1 45
11 2010Jul STW2 46
12 2010Jul STW3 48
13 2010Nov Influent 5
14 2010Nov STW1 18
15 2010Nov STW2 19
16 2010Nov STW3 17
17 2011Mar Influent 5
18 2011Mar STW1 18
19 2011Mar STW2 19
20 2011Mar STW3 17
21 2011Apr Influent NA
22 2011Apr STW1 19
23 2011Apr STW2 19
24 2011Apr STW3 18
25 2011May Influent NA
26 2011May STW1 21
27 2011May STW2 20
28 2011May STW3 19
29 2011June Influent NA
30 2011June STW1 21
31 2011June STW2 21
32 2011June STW3 21
> levels(figuredata$YearMonth) <-
+ figuredata$YearMonth[seq(1, 32, by = 4)]
>
>
> ggplot(figuredata, aes(x = YearMonth, y = TS)) +
+ geom_col(aes(color = Type, fill = Type),
+ width = 0.1,
+ position = position_dodge(width = 0.6)) +
+ geom_point(aes(color = Type, shape = Type),
+ position = position_dodge(width = 0.6)) +
+ scale_y_continuous(limits = c(0,100),
+ breaks = seq(0,100,by = 20)) +
+ geom_vline(xintercept = 5.5) +
+ annotate("text", x = c(3, 7), y = c(90, 90),
+ label = c("Feedind period", "Resting period") +
+ geom_hline(yintercept = seq(0,100,by = 20), linetype = 2) +
+ theme(panel.background = element_rect(fill = "white",
+ colour = "black",
+ legend.background = element_blank(),
+ legend.position = c(0.1,0.8),
+ legend.title = element_blank(),
+ legend.box.background = element_rect(fill = "white",
+ colour = "black",
+ legend.key = element_rect(colour = "black",
+ legend.key.width = unit(0.5, units = "cm",
+ legend.key.height = unit(0.5, units = "cm",
+ axis.text.x = element_text(colour = c("darkred",
+ rep("darkcyan", 3),
+ rep("darkblue", 4)))) +
+ labs(x = NULL, y = "TS(%)" +
+ scale_color_brewer(palette = "Spectral", type = "seq" +
+ scale_fill_brewer(palette = "Spectral", type = "seq"
Rplot.png
,
表情是圆括号右半部分,“)”,
感觉还是Origin好看一些。。。
谢谢谢谢,多谢!
跪求,大神教我一下,输入完数据,我应该怎么做,跪求
多谢大神,在你贴出图得提示下,我终于画出来了,多谢了