









| 查看: 983 | 回复: 3 | ||
[求助]
与编辑审稿意见不一样,怎么办呀????
|

|
最近投了篇文章在《new forests》,两个月后,文章的审稿意见出来了,大修,但是编辑有段话看不懂呀,麻烦各位大仙给看看。 Furthermore, the authors need to reconsider the organization of their results to improve the paper. The data of this paper can presented in only one Table and in a Figure. Most variables aren`t affected by the interaction between main factors (WS and AMF), so only results of main effects should be presented and not separated into the six treatments. This is the case of shoot and root dry weight, plant height, root length, water use efficiency, Chlorophyll concentration, all gas-exchange variables and qP. All these variables can be moved to a Table where variables must be rows and the columns must be the levels of the main factors (2 + 3 columns). At the right side of the table you can add your statistical analysis. Results on root colonization can be described in the text. Finally, RWC and results of the three reminder fluorescence variables can be presented in a figure made with four subfigures. In each subfigure, the six treatments should be presented separately. This would emphasize the interaction. 有两点不懂之处: 1、so only results of main effects should be presented and not separated into the six treatments. 2、the columns must be the levels of the main factors (2 + 3 columns). 如果我还是坚持自己原来的可以吗,或者有没必要给编辑部写封信讨论下这个问题。 所指表格见附图: 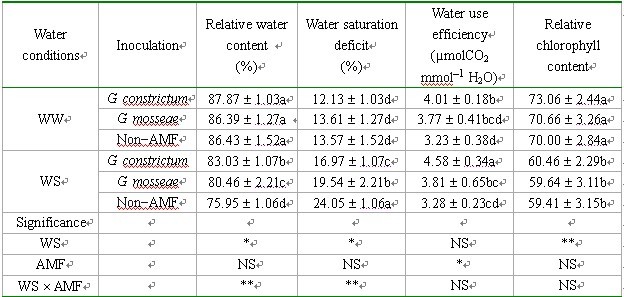 |
 回复此楼
回复此楼» 猜你喜欢
 各位大佬,路线设计求助
已经有7人回复
各位大佬,路线设计求助
已经有7人回复
-
我应该选哪条合成路线让实验成功率高一些?
已经有4人回复
-
烦躁
已经有7人回复
» 本主题相关价值贴推荐,对您同样有帮助:
- 编辑给的审稿意见怎么看都像少了一个人的,怎么办?
已经有5人回复
- SCI审稿意见回来了,编辑给的moderate revision,麻烦大家帮分析一下,有BB
已经有28人回复
- 编辑告诉我返回一个审稿意见?猜猜是positive还是negative?
已经有9人回复
- 系统附件里的审稿意见和邮箱里的审稿意见不一样,怎么办?
已经有24人回复
- 投材料科学与工艺3个月了,审稿意见也没回,打电话过去,编辑说暑假放假了!
已经有8人回复
- 老外编辑发错审稿意见了,怎么办?
已经有5人回复
- 按照审稿人的意见进行了修改之后,编辑的回复
已经有3人回复
- 都一年多了,还没给审稿意见,催稿,编辑不停的让推荐审稿人
已经有14人回复
- 编辑和审稿人给的意见不一致,我该怎么办?
已经有7人回复
- 编辑发错审稿意见,但文章无进展,如何处理
已经有9人回复
- 编辑发错审稿意见了如何写信询问
已经有15人回复
- 审稿结束6天了,编辑部还没有给我审稿意见,是不是凶多吉少啊,~~~~~
已经有35人回复
xinongfish
铁杆木虫 (著名写手)
- 应助: 266 (大学生)
- 贵宾: 0.321
- 金币: 9050.5
- 散金: 1197
- 红花: 14
- 沙发: 3
- 帖子: 1624
- 在线: 298.1小时
- 虫号: 848763
- 注册: 2009-09-15
- 性别: GG
- 专业: 森林健康

2楼2011-11-25 09:23:48
olg2007621
铜虫 (小有名气)
- 应助: 0 (幼儿园)
- 金币: 90.1
- 散金: 480
- 红花: 1
- 帖子: 283
- 在线: 52.1小时
- 虫号: 1304810
- 注册: 2011-05-24
- 性别: GG
- 专业: 森林经理学

3楼2013-10-29 13:00:32
kiyohawa
新虫 (小有名气)
- 应助: 0 (幼儿园)
- 金币: 1738.2
- 散金: 100
- 红花: 19
- 帖子: 213
- 在线: 136.2小时
- 虫号: 825757
- 注册: 2009-08-11
- 性别: GG
- 专业: 园林学
4楼2013-11-10 13:01:26