









| 查看: 4198 | 回复: 26 | |||
| 当前只显示满足指定条件的回帖,点击这里查看本话题的所有回帖 | |||
[求助]
求助用什么软件能处理tem图片,来求得其粒径 已有7人参与
|
|||

如图,用什么软件能求得其粒径分布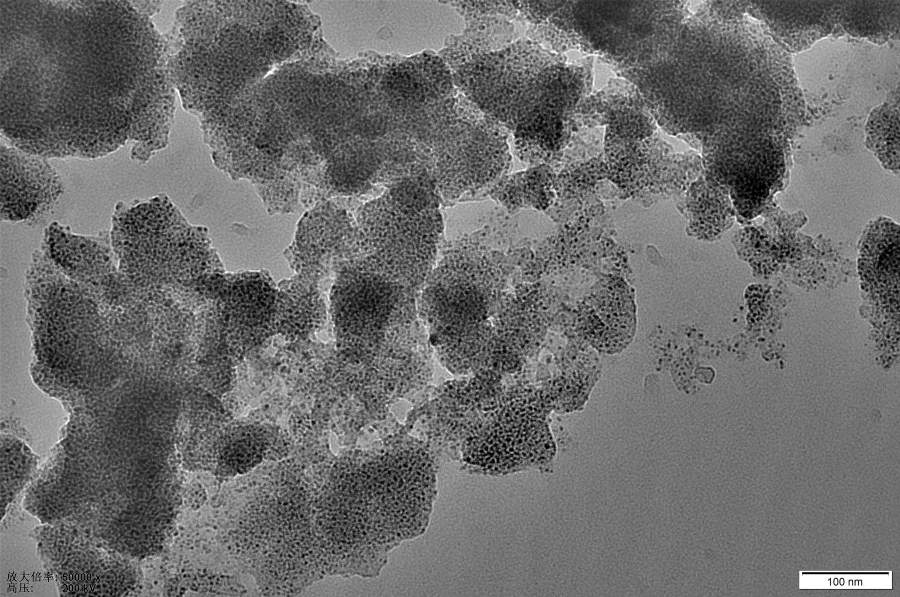 图像_211.jpg@dut_ameng |
 回复此楼
回复此楼» 猜你喜欢
 修改论文,如何借助其他力量?
已经有4人回复
修改论文,如何借助其他力量?
已经有4人回复
-
中山大学潘越教授课题组2027级推免硕士研究生招生 新增一个专业医学技术名额
已经有21人回复
-
金属材料论文润色/翻译怎么收费?
已经有236人回复
FMStation
至尊木虫 (知名作家)
- 应助: 591 (博士)
- 贵宾: 0.03
- 金币: 18780.7
- 红花: 97
- 帖子: 8891
- 在线: 1498.1小时
- 虫号: 2400059
- 注册: 2013-04-04
- 专业: 计算机应用技术
【答案】应助回帖
|
import into matlab <code> 1) reduce the graphics of the plot to the plain plot area (i.e. the axis-bound area) 2) import into matlab and display: imdata=flipdim(imread('fig1.png'),1); implot=imref2d(size(imdata)); implot.XWorldLimits=[xmin xmax]; implot.YWorldLimits=[ymin ymax]; imshow(imdata, implot); % if y is logarithmic (for x accordingly...) set(gca,'YScale','log'); % you might have to flip the axis direction set(gca,'YDir','normal'); % you probably want to adjust the image aspect ratio. set(gca,'DataAspectRatio',[1 70 1]); note: xmin, xmax, ymin, and ymax are the limits of the axes. replace them manually with the values of your figure. now you have a matlab reproduction of the figure, you like to have the data from. 3) "grab" the coordinates of a number of data points (npoints): [x,y] = ginput(npoints) move the mouse to the respective data points and (left) click. when clicked npoints, x and y coordinates of the npoints points in the plot's system are now stored in vectors x and y, respectively. </code> |

24楼2016-09-06 10:53:16
kangye_1989
木虫 (著名写手)
- 应助: 585 (博士)
- 金币: 1361.5
- 散金: 50
- 红花: 45
- 帖子: 1216
- 在线: 149.1小时
- 虫号: 2737587
- 注册: 2013-10-19
- 专业: 凝聚态物性 II :电子结构
2楼2016-09-01 13:14:13
450697740
铁杆木虫 (正式写手)
king
- 应助: 100 (初中生)
- 金币: 8765.8
- 红花: 10
- 帖子: 853
- 在线: 543.1小时
- 虫号: 2335279
- 注册: 2013-03-10
- 性别: GG
- 专业: 环境污染化学

3楼2016-09-01 13:23:25
4楼2016-09-01 13:43:06