








24小时热门版块排行榜    

查看: 6535  |  回复: 7
【奖励】 本帖被评价6次,作者hakuna增加金币 4.6
当前只显示满足指定条件的回帖,点击这里查看本话题的所有回帖

hakuna

木虫 (知名作家)


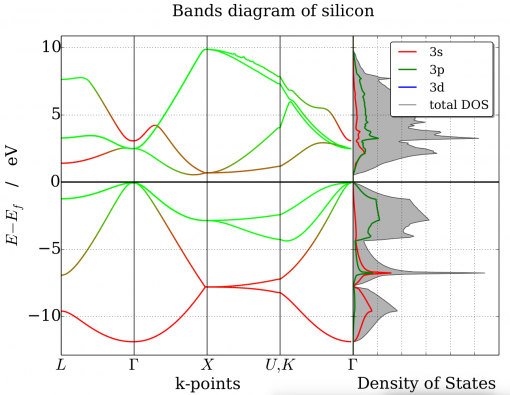
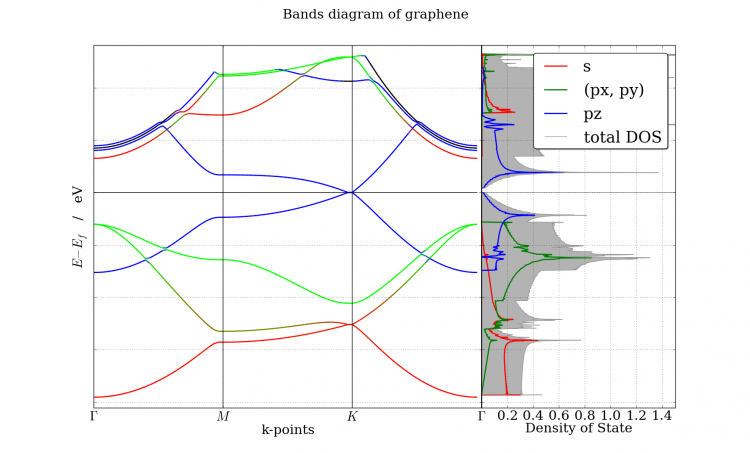
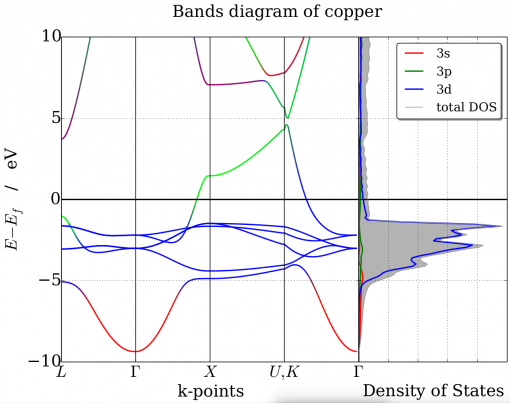
[资源] Bands diagram using VASP and pymatgen

原文地址:http://gvallver.perso.univ-pau.fr/?p=587
三个例子见附件
This article presents a python source code in order to plot the bands diagram of graphene calculated using VASP. The plot is done using pymatgen library and RGB coloring adapted from this example.
Edit 2016, March 15, update : source code is now python3 and pymatgen version 3.3.5 compatible
CODE:
#!/usr/bin/env python
# -*- coding=utf-8 -*-

import sys

import numpy as np
from numpy import array as npa

import matplotlib.pyplot as plt
from matplotlib.collections import LineCollection
from matplotlib.gridspec import GridSpec

import pymatgen as mg
from pymatgen.io.vasp.outputs import Vasprun, Procar
from pymatgen.symmetry.bandstructure import HighSymmKpath
from pymatgen.electronic_structure.core import Spin, Orbital


def rgbline(ax, k, e, red, green, blue, alpha=1.):
    # creation of segments based on
    # http://nbviewer.ipython.org/urls/raw.github.com/dpsanders/matplotlib-examples/master/colorline.ipynb
    pts = np.array([k, e]).T.reshape(-1, 1, 2)
    seg = np.concatenate([pts[:-1], pts[1:]], axis=1)

    nseg = len(k) - 1
    r = [0.5 * (red[i] + red[i + 1]) for i in range(nseg)]
    g = [0.5 * (green[i] + green[i + 1]) for i in range(nseg)]
    b = [0.5 * (blue[i] + blue[i + 1]) for i in range(nseg)]
    a = np.ones(nseg, np.float) * alpha
    lc = LineCollection(seg, colors=list(zip(r, g, b, a)), linewidth=2)
    ax.add_collection(lc)

if __name__ == "__main__":
    # read data
    # ---------

    # kpoints labels
    path = HighSymmKpath(mg.Structure.from_file("./opt/CONTCAR")).kpath["path"]
    labels = [r"$%s$" % lab for lab in path[0][0:4]]

    # bands
    bands = Vasprun("./bands/vasprun.xml").get_band_structure("./bands/KPOINTS", line_mode=True)

    # projected bands
    data = Procar("./bands/PROCAR").data

    # density of state
    dosrun = Vasprun("./dos/vasprun.xml")

    # set up matplotlib plot
    # ----------------------

    # general options for plot
    font = {'family': 'serif', 'size': 24}
    plt.rc('font', **font)

    # set up 2 graph with aspec ration 2/1
    # plot 1: bands diagram
    # plot 2: Density of State
    gs = GridSpec(1, 2, width_ratios=[2, 1])
    fig = plt.figure(figsize=(11.69, 8.27))
    fig.suptitle("Bands diagram of graphene")
    ax1 = plt.subplot(gs[0])
    ax2 = plt.subplot(gs[1])  # , sharey=ax1)

    # set ylim for the plot
    # ---------------------
    emin = 1e100
    emax = -1e100
    for spin in bands.bands.keys():
        for b in range(bands.nb_bands):
            emin = min(emin, min(bands.bands[spin][b]))
            emax = max(emax, max(bands.bands[spin][b]))

    emin -= bands.efermi + 1
    emax -= bands.efermi - 1
    ax1.set_ylim(emin, emax)
    ax2.set_ylim(emin, emax)

    # Band Diagram
    # ------------

    # sum up contribution over carbon atoms
    data = data[Spin.up].sum(axis=2)

    # sum up px and py contributions and normalize contributions
    contrib = np.zeros((bands.nb_bands, len(bands.kpoints), 3))
    for b in range(bands.nb_bands):
        for k in range(len(bands.kpoints)):
            sc = data[k][b][Orbital.s.value]**2
            pxpyc = data[k][b][Orbital.px.value]**2 + \
                data[k][b][Orbital.py.value]**2
            pzc = data[k][b][Orbital.pz.value]**2
            tot = sc + pxpyc + pzc
            if tot != 0.0:
                contrib[b, k, 0] = sc / tot
                contrib[b, k, 1] = pxpyc / tot
                contrib[b, k, 2] = pzc / tot

    # plot bands using rgb mapping
    for b in range(bands.nb_bands):
        rgbline(ax1,
                range(len(bands.kpoints)),
                [e - bands.efermi for e in bands.bands[Spin.up][b]],
                contrib[b, :, 0],
                contrib[b, :, 1],
                contrib[b, :, 2])

    # style
    ax1.set_xlabel("k-points")
    ax1.set_ylabel(r"$E - E_f$   /   eV")
    ax1.grid()

    # fermi level at 0
    ax1.hlines(y=0, xmin=0, xmax=len(bands.kpoints), color="k", lw=2)

    # labels
    nlabs = len(labels)
    step = len(bands.kpoints) / (nlabs - 1)
    for i, lab in enumerate(labels):
        ax1.vlines(i * step, emin, emax, "k")
    ax1.set_xticks([i * step for i in range(nlabs)])
    ax1.set_xticklabels(labels)

    ax1.set_xlim(0, len(bands.kpoints))

    # Density of state
    # ----------------

    ax2.set_yticklabels([])
    ax2.grid()
    ax2.set_xticks(np.arange(0, 1.5, 0.4))
    ax2.set_xticklabels(np.arange(0, 1.5, 0.4))
    ax2.set_xlim(1e-6, 1.5)
    ax2.hlines(y=0, xmin=0, xmax=1.5, color="k", lw=2)
    ax2.set_xlabel("Density of State")

    # s contribution
    ax2.plot(npa(dosrun.pdos[0][Orbital.s][Spin.up]) +
             npa(dosrun.pdos[1][Orbital.s][Spin.up]),
             dosrun.tdos.energies - dosrun.efermi,
             "r-", label="s", linewidth=2)

    # px py contribution
    ax2.plot(npa(dosrun.pdos[0][Orbital.px][Spin.up]) +
             npa(dosrun.pdos[1][Orbital.px][Spin.up]) +
             npa(dosrun.pdos[0][Orbital.py][Spin.up]) +
             npa(dosrun.pdos[1][Orbital.py][Spin.up]),
             dosrun.tdos.energies - dosrun.efermi,
             "g-",
             label="(px, py)",
             linewidth=2)

    # pz contribution
    ax2.plot(npa(dosrun.pdos[0][Orbital.pz][Spin.up]) +
             npa(dosrun.pdos[1][Orbital.pz][Spin.up]),
             dosrun.tdos.energies - dosrun.efermi,
             "b-", label="pz", linewidth=2)

    # total dos
    ax2.fill_between(dosrun.tdos.densities[Spin.up],
                     0,
                     dosrun.tdos.energies - dosrun.efermi,
                     color=(0.7, 0.7, 0.7),
                     facecolor=(0.7, 0.7, 0.7))

    ax2.plot(dosrun.tdos.densities[Spin.up],
             dosrun.tdos.energies - dosrun.efermi,
             color=(0.6, 0.6, 0.6),
             label="total DOS")

    # plot format style
    # -----------------

    ax2.legend(fancybox=True, shadow=True, prop={'size': 18})
    plt.subplots_adjust(wspace=0)

    # plt.show()
    plt.savefig(sys.argv[0].strip(".py") + ".pdf", format="pdf")

Bands diagram using VASP and pymatgen
bands_Cu-510x403.png


Bands diagram using VASP and pymatgen-1
bands_Si-510x395.png


Bands diagram using VASP and pymatgen-2
graphene-750x453.png
回复此楼

» 本帖附件资源列表

  • 欢迎监督和反馈:小木虫仅提供交流平台,不对该内容负责。
    本内容由用户自主发布,如果其内容涉及到知识产权问题,其责任在于用户本人,如对版权有异议,请联系邮箱:xiaomuchong@tal.com
  • 附件 1 : Cu_bands.zip
  • 2016-03-25 17:34:49, 1.18 M
  • 附件 2 : graphene.zip
  • 2016-03-25 17:34:59, 5.52 M
  • 附件 3 : Si_bands.zip
  • 2016-03-25 17:35:00, 720.29 K

» 收录本帖的淘帖专辑推荐

MD Composite

» 猜你喜欢

已阅   回复此楼   关注TA 给TA发消息 送TA红花 TA的回帖

emilyoyang

木虫 (正式写手)


分享的这个code 太过时了! 后来者看了 运行会遇到各种各样错误,
我在这里分享一个最新的,https://github.com/materialsvirt ... re%20of%20NiO.ipynb
Germain Salvato Vallverdu十天前写的一个教程
3楼2018-03-13 04:06:22
已阅   回复此楼   关注TA 给TA发消息 送TA红花 TA的回帖
查看全部 8 个回答

★★★ 三星级,支持鼓励

其实没必要用pymatgen,你用那个库无非就是读vasprun.xml和procar
5楼2018-09-24 12:10:39
已阅   回复此楼   关注TA 给TA发消息 送TA红花 TA的回帖

爱亚的猩猩

新虫 (正式写手)


★★★★★ 五星级,优秀推荐

你好啊 我在运行您的例子的时候 提示了ModuleNotFoundError: No module named 'pymatgen.io.vaspio',您知道是什么原因吗?谢谢你啦
8楼2020-01-20 09:48:12
已阅   回复此楼   关注TA 给TA发消息 送TA红花 TA的回帖
简单回复
mink6楼
2019-05-11 08:56   回复  
五星好评  顶一下,感谢分享!
springxa7楼
2019-11-30 00:17   回复  
五星好评  顶一下,感谢分享!
败剑庐4楼
2018-09-24 10:04   回复  
五星好评  顶一下,感谢分享!
☆ 无星级 ★ 一星级 ★★★ 三星级 ★★★★★ 五星级
普通表情 高级回复 (可上传附件)
最具人气热帖推荐 [查看全部] 作者 回/看 最后发表
[基金申请] 估计是周四 +3 archvillain 2026-08-18 3/150 2026-08-21 01:48 by jnhyjjm
[基金申请] 言之凿凿,明天官网会通知放榜? +15 医学老男孩 2026-08-20 17/850 2026-08-20 20:35 by CaoLG
[基金申请] 时间戳又变了 +12 wuchongjun 2026-08-20 17/850 2026-08-20 20:05 by spzhao
[基金申请] 今天系统多次维护,明天很可能放榜! +10 zju2000 2026-08-16 11/550 2026-08-20 20:02 by cl479861084
[基金申请] 时间戳变了,能看出什么问题? +18 基诺咪客 2026-08-17 23/1150 2026-08-20 17:19 by Godzela
[基金申请] 放榜前的不淡定 40+3 snowwithsea 2026-08-19 12/600 2026-08-20 15:56 by lfy8008
[基金申请] 重要消息,中午系统在维护 +11 yuleib84 2026-08-18 12/600 2026-08-20 11:09 by xskun
[基金申请] filecode,4个jtjc了 +11 ziyangfang 2026-08-19 13/650 2026-08-19 21:28 by aasahr
[教师之家] 为什么余额宝的年化利率越来越低?主要原因有哪些? +5 瞬息宇宙 2026-08-15 5/250 2026-08-19 20:23 by super2002521
[基金申请] 今天放榜没戏了吧 +4 yuleib84 2026-08-19 5/250 2026-08-19 19:52 by hhs666
[基金申请] 今天放榜吗? +14 布布和一二 2026-08-19 15/750 2026-08-19 18:07 by gltch
[基金申请] 2027广东省杰青 +4 奶牛小黑 2026-08-15 10/500 2026-08-19 11:02 by wanfengnew
[基金申请] 快农历七夕节了,轻松一下,男人悄悄话,女施主请不要进来。 +6 Tide man 2026-08-14 7/350 2026-08-19 09:56 by ZJTJZ
[论文投稿] 投稿咨询 +4 wwm09 2026-08-17 6/300 2026-08-18 15:36 by wwm09
[基金申请] 时间戳又变了8-15 +14 archvillain 2026-08-15 26/1300 2026-08-18 13:37 by phantomgost
[基金申请] 今天维护系统维护 祝所有人 高中 +8 gjjjzhong 2026-08-18 9/450 2026-08-18 13:01 by 家与远方
[基金申请] 93BebMhtakh前后11位开头都是大写 +4 且听虎啸 2026-08-17 5/250 2026-08-18 00:49 by 蔡棒棒菂
[基金申请] 感觉是下周放榜了 +6 angus9576 2026-08-17 11/550 2026-08-17 23:57 by angus9576
[精细化工] 招聘 金属平磨液,抛光液研发工程师 +3 小天0311 2026-08-14 3/150 2026-08-16 07:31 by H9PLUS
[基金申请] 各位道友,我要去昆明玩几天,回来见。 +7 Tide man 2026-08-14 8/400 2026-08-15 01:11 by arzu_hma
信息提示
请填处理意见